

Every few weeks, a solar owner calls our office with the same complaint, and it is almost always someone whose system was sold by another company: they had no electric bill after installation, and now the bills are back. Something must be broken. Almost every time, nothing is broken. The house is simply using more electricity than the roof is making, and the December net metering reset made sure the year started with nothing in the bank to cover the difference.
That is the whole answer to “why am I getting an electric bill with solar panels?” It is not complicated. But I understand why it is not obvious to the people living it. The monitoring apps do a poor job of showing it, and some of these owners were told something very different at the kitchen table. So let me walk through a real example, with a chart the app will never draw for you.
A Real System, a Real Phone Call
This week an Enphase owner in Charlotte County asked us to take over monitoring and service on a system another contractor installed in June 2025. His concern was simple. After installation, no bills. For months now, bills. He wanted to know what was wrong with the system.
I pulled up the data. Production looked great. Every microinverter was reporting, and the monthly output was right where it should be for the array size and the season. There was nothing to fix on the roof.
Then I looked at the year totals, which the Enphase app shows right at the top of the Year view:
2025 (June through December): 10.0 MWh produced, 10.2 MWh consumed. That is break even, give or take a rounding error.
2026 (January through mid-November): 17.5 MWh produced, 22.6 MWh consumed. That is 5.1 MWh short.
Same panels. Same roof. Same sun. The house used about 5,100 more kilowatt-hours than the system made, and the utility sent a bill for every one of them. At FPL’s marginal residential rate, which runs roughly 14 cents per kWh all-in, that is somewhere around $715 in energy charges so far this year. That is your bill.
How Net Metering Actually Banks Your Credits
To understand why the bills showed up when they did, you need to know how the credit bank works. If you want the full primer, our explanation of solar net metering covers the basics. Here is the short version.
In a month where your panels make more than your house uses, the extra kilowatt-hours roll forward as credits. In a month where your house uses more than your panels make, those banked credits get spent first. Once the bank is empty, you pay for every kilowatt-hour you pull from the grid at full retail price.
Then comes December. Under Florida’s net metering rules, the year closes out on the December bill. Any leftover credits are cashed out at a low wholesale rate, and the bank starts January at zero. Your credits do not carry into the new year.
That reset is the part people miss. It means every January is a fresh start, and a fresh start is only good news if you can bank credits before you need them.
Why the First Few Months Felt Free
Go back to this homeowner’s first season. The system turned on in June 2025. July and August were strong production months, and the household used relatively little power those two months. The system banked roughly 690 kWh of credits over the summer.
September and October flipped. The house used more than the panels made in both months. But there was a bank to draw from, so those months were covered. November roughly broke even. By the December bill, the bank was empty and the year closed out about even.
From the homeowner’s side of the kitchen table, that looked like “solar eliminated my bill.” In reality, a good summer subsidized a deficit fall, and the books happened to balance. Not a big surplus. Not a big deficit. A coin that landed on its edge.
Aside from FPL’s fixed monthly charges, which you pay no matter how much you produce, he saw little or nothing in energy charges. That set an expectation the numbers were never going to support once the household’s usage changed.
“You Will Never Have an Electric Bill Again”
Our own customers rarely make this call. Their homes use more power some years too, but we tell them before they sign exactly how net metering works, what the December reset does, and that their bill will move with their usage. We size every system from twelve months of actual usage, and we say plainly that an EV, a pool heater, or a full-time resident changes the math.
Most of these calls come from owners of systems someone else sold, and too many of them were promised some version of “you will never have an electric bill again.” That is not true for any FPL customer. FPL charges a fixed monthly customer charge and enforces a minimum bill no matter how much your system produces. No system of any size takes an FPL bill to zero.
It is not true in the bigger sense either. A solar system makes a roughly fixed amount of energy. Whether that covers your usage depends on how you live, and nobody at a kitchen table can promise what you will use three years from now. A salesperson who promises a zero bill is either guessing about your future or telling you what you want to hear. Neither one is a design.
If you were given that promise, the problem is not your panels. It is the pitch.
The Chart Your Monitoring App Will Not Show You
Here is the problem with how every monitoring platform presents this. Enphase, Tesla, SolarEdge, and the rest show you monthly bars: production up, consumption down. You can look at twelve bars and never quite register how the gaps add up. What they do not show is a running total, which is exactly how your utility keeps score.
So I built one. The chart below adds production minus consumption month by month, starting from zero at the beginning of each billing year. Above the line, you are banking credits. Below the line, you are buying power.
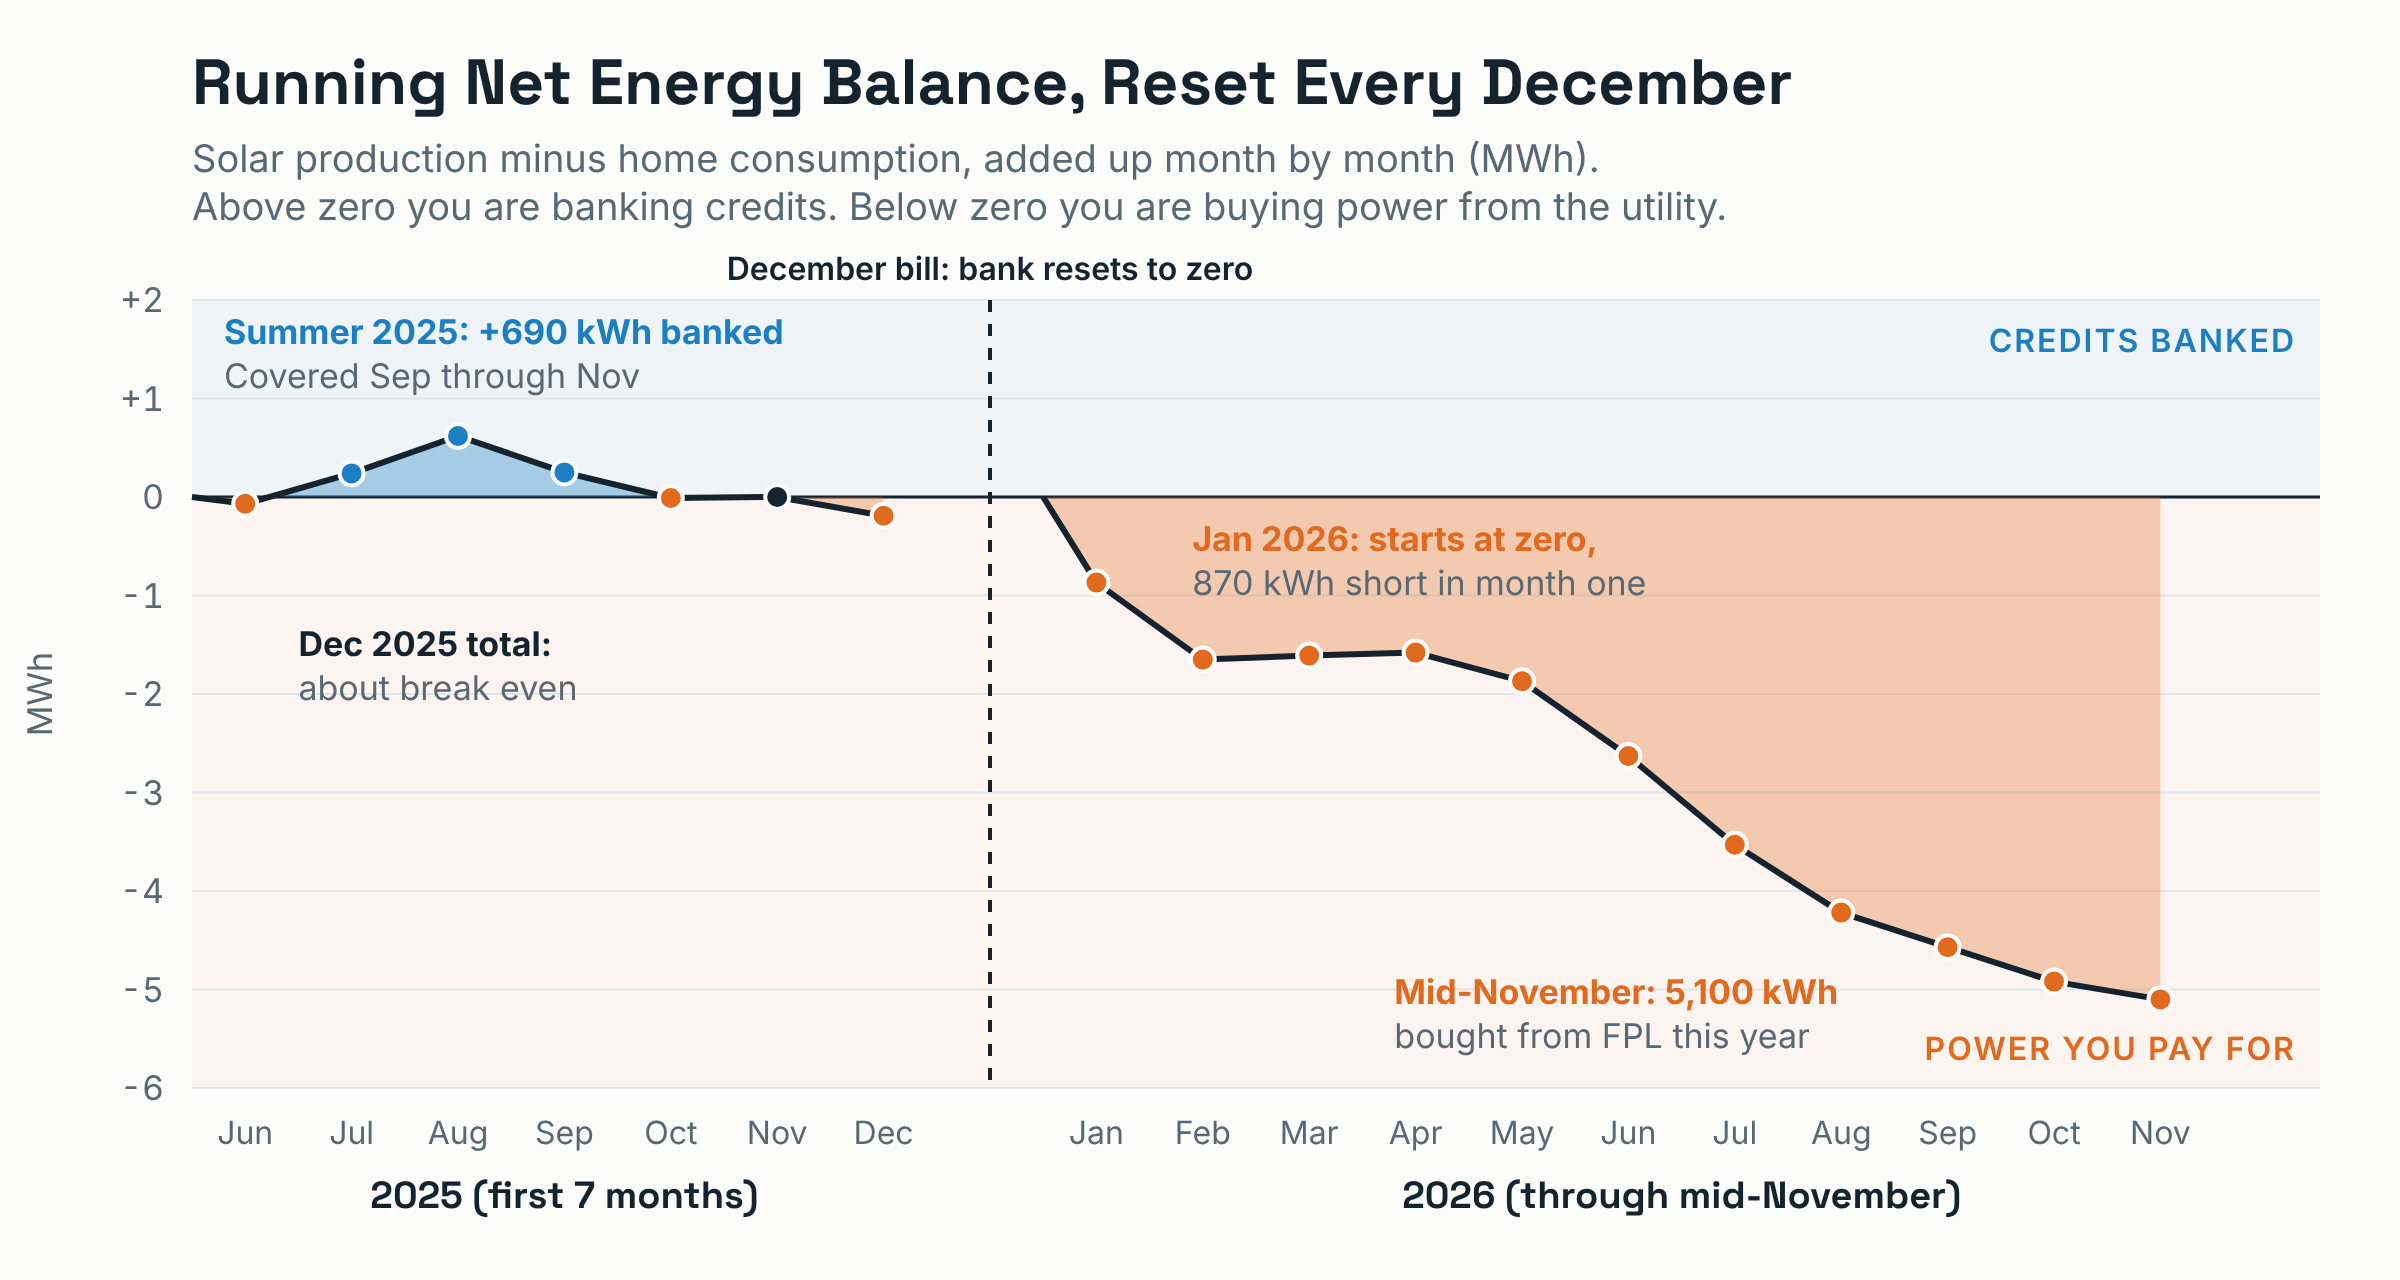
Look at what happens on January 1, 2026. The bank is at zero because of the December reset. In January alone, the house used about 870 kWh more than the panels made (likely due to home heating or pool heating). There was nothing in the bank to absorb it. That shortfall was billed immediately.
February did it again. March and April came close to break-even, and the system banked a few dozen kilowatt-hours, which May promptly spent. From May forward, the line goes in one direction. Every summer month added another 700 to 900 kWh of purchased power. By mid-November, the running total sits at 5,100 kWh in the hole.
The line never once climbed back above zero in 2026. That is why there have been bills every month. Not “the last several months.” Every month. The summer ones were just bigger.
Same Months, One Year Apart
Comparing seven months of 2025 to eleven months of 2026 is not a fair fight, so here is the honest comparison: the four full months we have for both years, July through October.
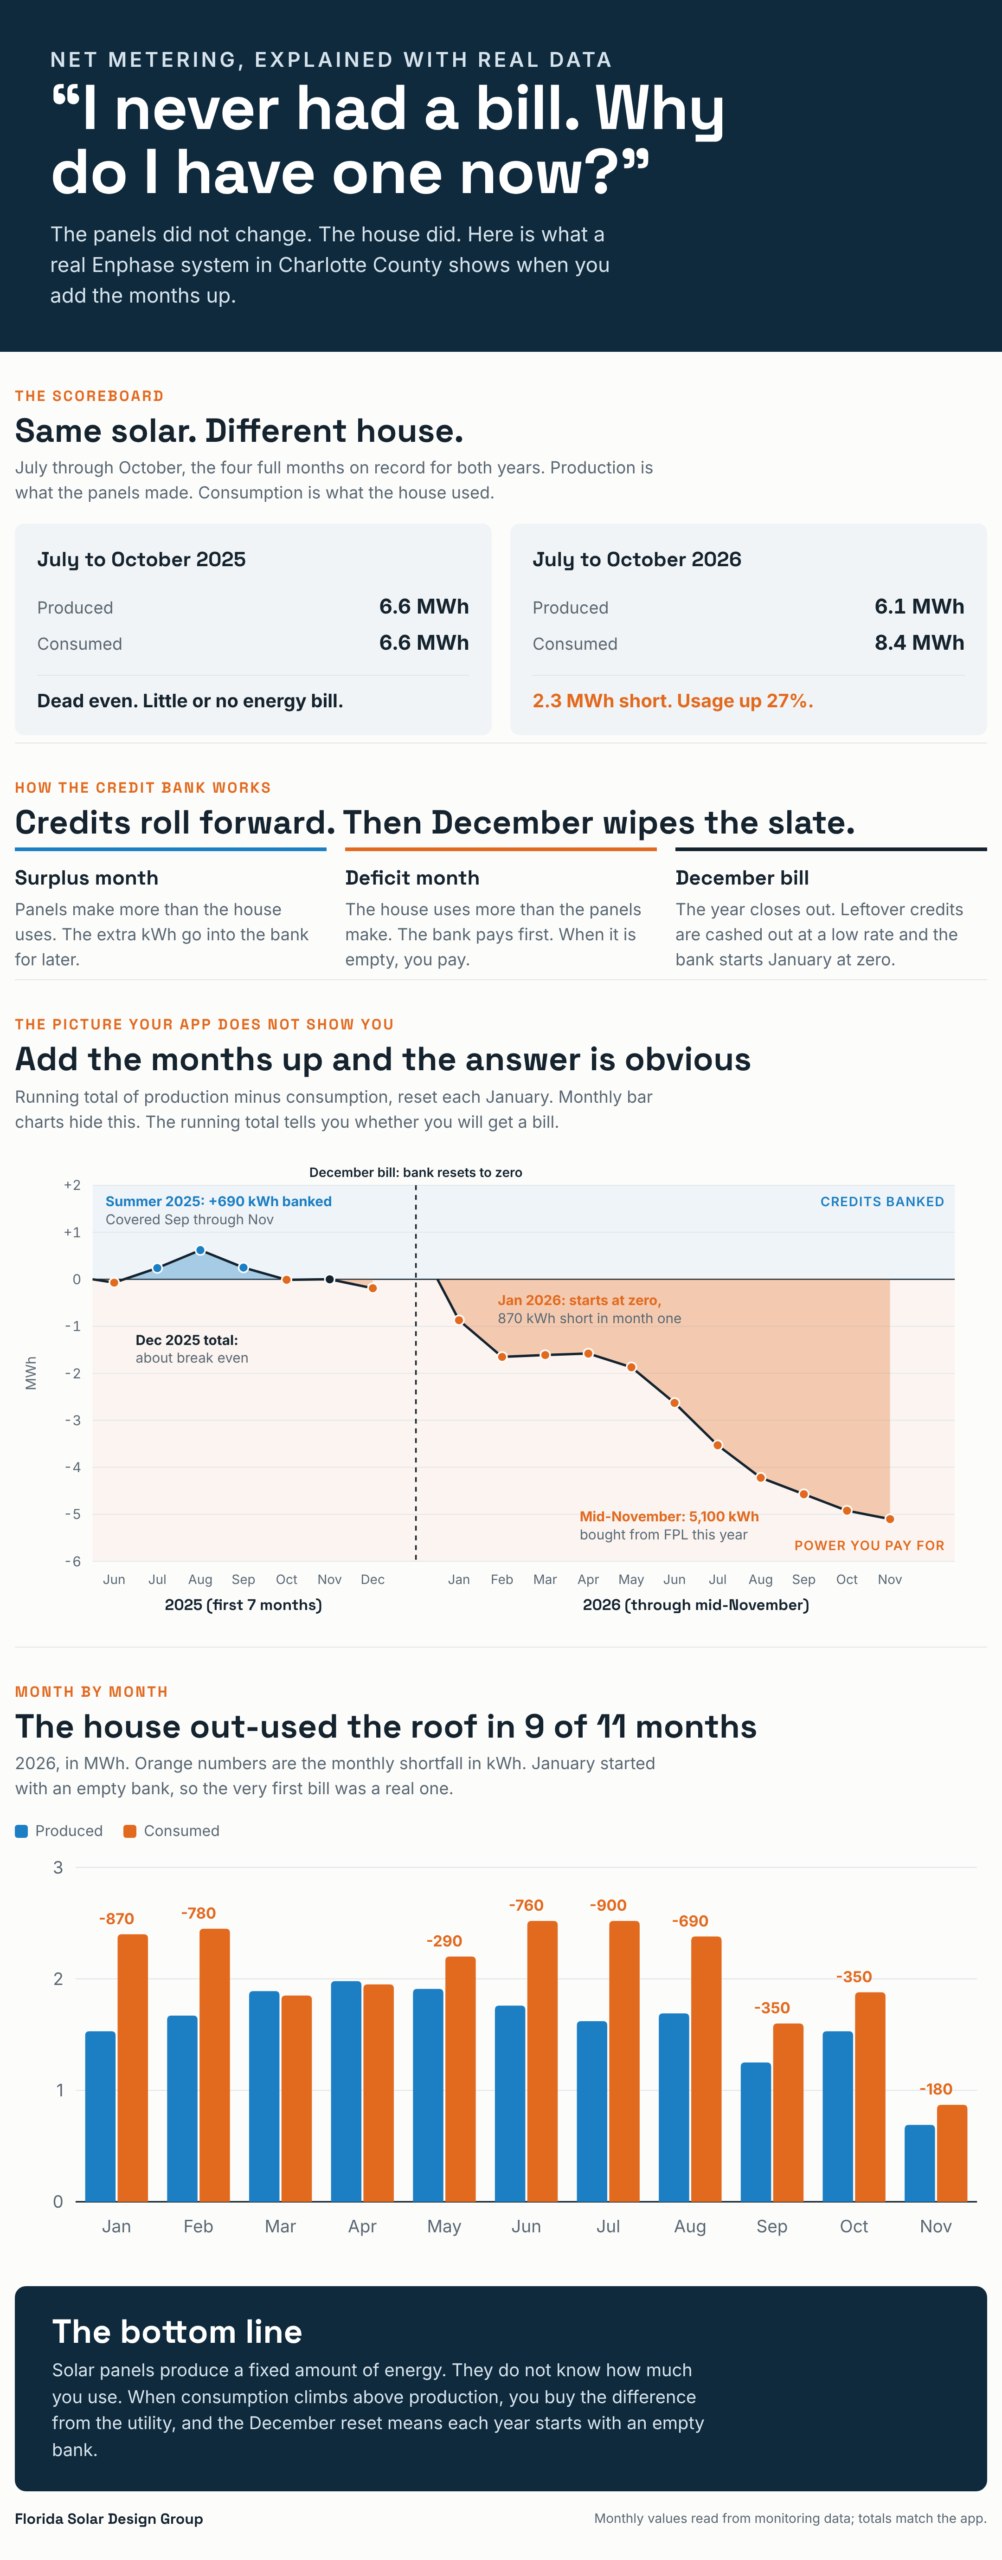
July to October 2025: 6.6 MWh produced, 6.6 MWh consumed. Dead even.
July to October 2026: 6.1 MWh produced, 8.4 MWh consumed. 2.3 MWh short.
Consumption went up 1.8 MWh, about 27 percent. Production went down about 0.55 MWh, most of it in September. Weather moves production from year to year, and one gray month moves it a lot. But even if production had matched last year exactly, this house would still be 1.7 MWh short over those four months.
The jump is concentrated in summer. July went from about 1.4 MWh to 2.5 MWh. August went from about 1.25 MWh to 2.4 MWh. The panels made roughly the same energy both summers. The house nearly doubled its appetite.
I do not know what changed in this household, and frankly it is not my business. Here is what usually explains this pattern in Southwest Florida:
Occupancy. A seasonal resident who starts staying through the summer, a family member who moves in, or a summer with houseguests. Summer is when Florida homes use the most power, so being here in July and August costs real kilowatt-hours.
New loads. An electric vehicle, a pool heat pump, a second refrigerator or mini-split air conditioner in the garage, a golf cart, a workshop. Each one is a few hundred kilowatt-hours a month that did not exist when the system was sized.
Air conditioning. A thermostat set two degrees lower, an aging system losing efficiency, a clogged filter, or a duct leak in the attic. AC is the largest load in nearly every Florida home, so small changes there show up big on the bill.
None of these are solar problems. The solar system has no idea what you plugged in.
“But the Meter Is Doing Something Weird”
This homeowner also mentioned that his meter showed strange readings, and that his neighbor’s did too. That is normal. FPL’s bidirectional meters scroll through several readings, including what you pulled from the grid and what you pushed back to it. If you want to know what you are looking at, we have a guide on how to read a bidirectional net meter. Two neighbors with solar seeing the same “weird” display is a good sign that both meters are working as designed.
How to Check Your Own Numbers
You do not need a custom chart to figure out whether you should expect a bill. You need two numbers and a calendar.
In the Enphase app, open the Energy tab, choose Year, and look at the totals above the graph. Produced, consumed, and net imported are all right there. If consumed is higher than produced for the year, you are going to pay for the difference. Use the Custom range from January 1 to today if you want a year-to-date snapshot mid-year.
If your app only shows production and not consumption, your system does not have consumption monitoring installed. In that case, compare your app’s production to the total kilowatt-hours on your FPL bills for the same period. If you want to understand every line on that bill, here is our guide to reading an FPL net metering bill.
One more point. If you are on FPL’s budget billing, turn it off. It smooths the payments in a way that hides exactly what this post is about, and it does not play well with net metering. Here is why budget billing does not work with net metering.
What You Can Actually Do About It
If production is healthy and consumption is up, you have two levers. That is it.
Use less. Look at the AC first. Have it serviced, check the thermostat schedule, and look hard at any new loads that arrived in the last year. Your consumption data will tell you which months jumped, and that usually points straight at the cause.
Make more. If the household’s new normal is higher usage, the system may simply be undersized for the way you live now. This home is on pace to use roughly 24 to 25 MWh a year against roughly 19 MWh of production. Closing that gap would take about 30 percent more array, assuming there is roof space for it. Enphase systems are about the easiest systems to expand, because each panel has its own microinverter and new panels can be added in small increments.
What you should not do is assume the system failed. Check the production first. If it matches what the system was designed to make, the system is doing its job.
The Bottom Line
If you are getting an electric bill with solar panels, the most likely reason is the least exciting one: over the billing year, your house used more electricity than your panels produced. The December net metering reset starts every January at zero, so a household that runs a deficit early in the year pays for it immediately, and a household that runs a deficit all year pays every month.
Solar panels make a fairly predictable amount of energy. They do not adjust to what you plug in. When consumption goes up, the bill goes up, and no amount of sunshine you already used last year will cover it.
If you have an Enphase, Tesla, or other system in Southwest Florida and you are not sure whether your bill is a consumption issue or a production issue, we can look at your monitoring data and tell you. If it is production, we will find it. If it is consumption, we will tell you that too and help you decide whether expanding the array makes sense.


